Best Greyhound Betting Sites – Bet on Greyhounds in 2026
Loading...
The Racecard Is a Story, Not a Spreadsheet
Greyhound form is compact, information-dense, and — to the uninitiated — completely opaque. A single line of form figures can tell you where a dog finished, how it ran, what trap it started from, and what time it recorded. But knowing what those numbers mean and knowing what to do with them for Derby betting are different skills entirely. The racecard gives you data. Interpretation turns that data into an opinion.
Derby form is a specific discipline within greyhound form reading. The competition’s multi-round format means that by the semi-finals, each surviving dog has accumulated five or six runs at the same venue, under comparable conditions, against progressively stronger opposition. That depth of data is unusual in greyhound racing, where most dogs race weekly in different contexts. For the attentive bettor, the Derby’s form trail is one of the richest analytical resources the sport provides.
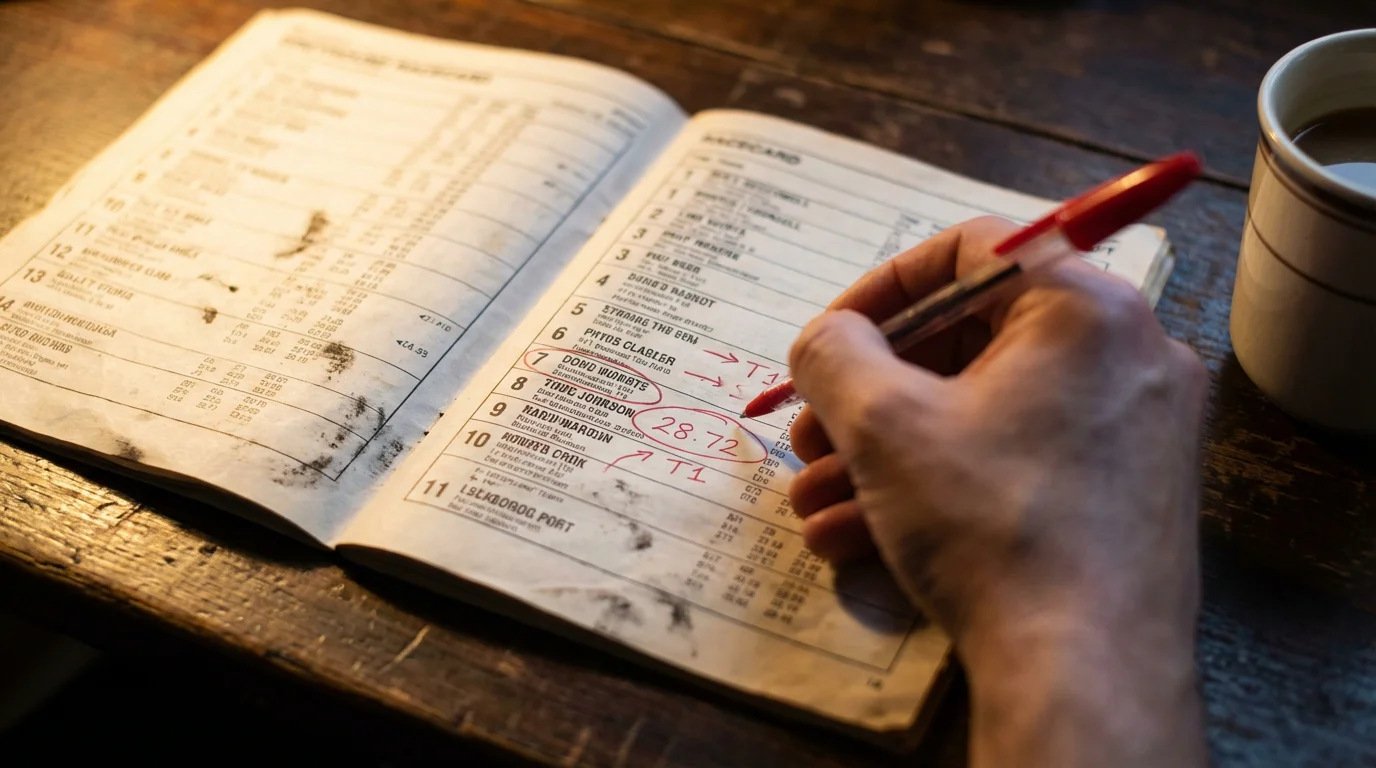
Racecard Basics
A greyhound racecard contains a standard set of information for each runner in a race. The essentials are: the dog’s name, its trap number and jacket colour, its trainer, its recent form figures, the distance and venue of each recent run, its finishing time, its sectional time to the first bend, and its weight. Some racecards also include the dog’s age, its dam and sire, and any comments from the racing manager about its running style or recent performances.
The trap number tells you where the dog starts. The form figures — a sequence of numbers such as 1-3-2-1-4 — tell you where it finished in each of its last five or six races, reading from left to right as most recent to oldest. A “1” means it won. A “6” means it finished last. Letters may appear in place of numbers: “F” for a fall, “B” for brought down by interference, “D” for disqualified, and “R” for a refusal to enter the traps.
The finishing time is expressed in seconds to two decimal places — a typical 500-metre time at Towcester might read 28.72 or 29.15. This time is the dog’s overall performance from trap to finish, and it is the number most punters look at first. It is also the number most likely to mislead if taken at face value, because it does not account for going conditions, traffic problems, effort level, or the quality of opposition. A 28.60 recorded against moderate dogs on fast going tells you less than a 29.00 recorded against quality opposition on slow going with early interference.
The weight, recorded in kilograms, is a form indicator that many bettors undervalue. Greyhounds are athletes operating at near-maximum effort, and small weight changes can indicate fitness shifts. A dog that has gained half a kilogram between rounds may be holding condition well — a positive sign. A dog that has lost a kilogram may be showing signs of the competition’s physical toll. Weight alone is never a selection criterion, but it adds context to form that the finishing time does not provide.
Form Figures Decoded
Form figures are the shorthand history of a dog’s recent racing career, and reading them properly requires more than counting how many ones appear. The pattern matters as much as the individual numbers.
A sequence of 1-1-1-1-1 looks impressive, but it tells you nothing about the quality of those wins. Were they in graded company against average opposition? Were they at a different track, over a different distance, on a different surface? A dog with five consecutive wins in A2 graded racing at a provincial track has a fundamentally different profile from a dog with five wins in open competition at Towcester. The form figure is the same — but the form itself is worlds apart.
A sequence of 3-2-1-1-1 is often more informative than a string of ones. It suggests a dog that has been improving, that its fitness and form are trending upward, and that its most recent performances represent its current level rather than a historical average. For Derby betting, where dogs are racing at the same venue over consecutive weeks, an improving trend is one of the strongest signals available. A dog that finished third in its first-round heat, second in round two, and won in round three is peaking at the right time — and its early defeats may have been the result of draw disadvantages or tactical adjustments rather than inferior ability.
Equally, watch for sequences that suggest decline. A 1-1-2-3-4 pattern shows a dog that was at its best several races ago and has been gradually fading. In the Derby context, this might indicate physical fatigue — five weeks of high-intensity racing takes a toll, and not every dog maintains peak condition through the entire competition. The market may still be pricing this dog on the strength of its early-round performances, creating an opportunity to oppose it at shorter odds than its current form warrants.
Letters in the form line demand particular attention. A “B” — brought down — means the dog’s poor finishing position was not its fault. It was interfered with and could not show its true ability. A “B” in the most recent run, followed by a 1 or 2 in the run before, suggests a dog that is better than its last result implies. The market sometimes overreacts to a poor finishing position without checking whether interference was the cause, creating value on a dog whose underlying form is stronger than the headline figure.
What to Prioritise for Derby Form
Not all form is equally relevant to the Derby. The competition’s specific demands — same venue, same distance, progressive elimination, seeded draw — mean that certain types of form data are more predictive than others.
Towcester form is the gold standard. A dog’s recent runs at Towcester, over the 500-metre Derby distance, are the most directly comparable data points. Form from other venues — even strong form at Shelbourne or Romford — must be translated through the lens of venue difference. A dog that runs 28.50 at a different track might run 28.80 or 29.10 at Towcester, depending on the track geometry, surface, and configuration. Towcester-specific form eliminates this translation problem entirely.
Open-race form trumps graded form. The Derby is an open race, and the competitive dynamics of open racing — where any dog can be drawn against any other, regardless of grading — are fundamentally different from graded racing, where the field is balanced by the racing manager. A dog with strong open-race form has demonstrated it can compete against ungradable opposition. A dog with only graded form, however impressive, is stepping into an unknown competitive tier when it enters the Derby.
Round-by-round progression is the Derby’s unique form dataset. By round three, each surviving dog has accumulated three runs at Towcester under Derby conditions. You can track whether it is improving, holding steady, or declining. You can compare its sectional times across rounds to identify shifts in running style. You can note whether it has handled different trap allocations in different rounds, and how its performance changed with the draw. No other greyhound competition provides this depth of same-venue, sequential form data, and exploiting it fully is one of the most reliable edges in Derby betting.
Finally, prioritise race position over finishing time. A dog that leads at the first bend and controls the race from the front has demonstrated early pace and tactical superiority. A dog that is consistently slow to the first bend but closes strongly has demonstrated finishing speed and resilience. The finishing time combines both attributes into a single number, losing the distinction. For Derby betting — where the draw determines which running style is advantageous in any given heat — knowing how a dog runs is more valuable than knowing how fast it runs.
Applying Form to Draw Analysis
Form and draw are not separate inputs — they are two halves of the same assessment. A dog’s form tells you what it is capable of. The draw tells you whether the conditions allow it to deliver that capability. The bettor’s job is to combine both into a single probability estimate.
Start with the dog’s established running style, derived from form. Is it a front-runner that leads from the traps? A mid-division runner that picks off tiring leaders? A closer that comes from behind in the final 100 metres? Each style has an optimal draw profile. Front-runners want inside traps with clear early space. Mid-division runners want middle traps that avoid both congestion and excessive distance. Closers want traps that allow them to settle without being forced into early battles for position.
Next, overlay the actual draw. Does the trap allocation match the dog’s running style? If yes, the form data can be taken at something close to face value — the dog is in a position to reproduce its best performances. If no, the form data must be discounted by the degree of mismatch. A front-runner in Trap 5 must overcome positional disadvantage before it can display the early pace that its form shows. That disadvantage might cost a length at the first bend, which might be the difference between leading and chasing, which might be the difference between winning and finishing third.
The final step is to assess the neighbours. Form tells you what each dog in the heat does. The draw tells you where they start. Combining the two reveals the likely first-bend scenario: which dog leads, which dogs are caught in traffic, which dogs have clear space. This scenario modelling — built on form data, informed by draw allocation, and projected onto the specific dynamics of each heat — is the analytical core of Derby betting. The punter who does it rigorously, race by race, round by round, has a systematic advantage over those who check the form, glance at the trap, and back their instinct.